
Combining answers from documents with business predictions
Ask an internal AI assistant which customers the team should contact first next month. Finding the customer-contact policy will not settle the priority order. The task also requires aggregating orders, predicting future purchasing, and considering how many people the team can contact. This is a hypothetical workflow used here to make the additional work of using predictions concrete.
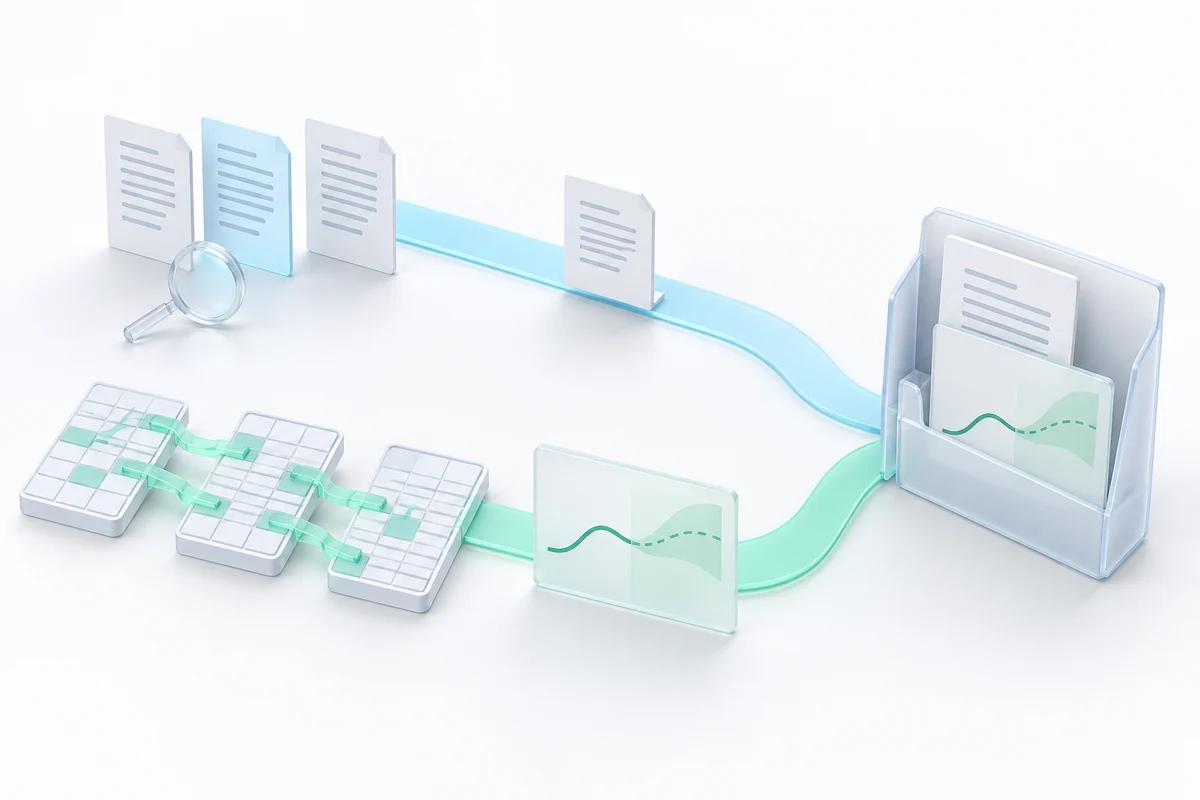
NVIDIA's October 21 expansion of Agent Toolkit presents this combination in a product architecture. Agent Knowledge Foundation includes Nemotron Retriever for finding relevant information alongside Kumo for predictions from structured data. Beyond turning tables into text for an LLM to read, an agent can call predictive models suited to the data's structure as tools.
The announcement date needs to be distinguished from when the technology appeared. Kumo Tabular's technical announcement dates to September 29, and Kumo Anomaly's model card lists June 29 as its release date. The development highlighted by this announcement is the presentation of retrieval and prediction together in an enterprise agent stack, rather than the invention of every predictive component this week.
Three different answers behind a customer-contact decision
The opening request contains three different questions: what rules govern customer contact, whose orders have recently declined, and whose orders are likely to stop in the future. Even if the team eventually sees a single candidate list, the methods used to produce and verify its columns differ.
| What the team needs to know | Processing and result | What needs verification |
|---|---|---|
| Rules for contacting customers | Document retrieval and generation of a cited explanation | Policy version, applicability, and fidelity to the citation |
| Changes in past orders | SQL or other computation of recorded counts and amounts | Customers, period, joins, and aggregation |
| Likelihood that orders will stop | A model's probability or ranking for a defined event | Performance on an unseen period and reliability of probabilities |
Retrieval-augmented generation (RAG) uses retrieved material to support generation, as described in the original paper. An LLM can also receive order aggregates and prediction outputs when composing an explanation. Fluent prose, however, does not establish the accuracy of the underlying prediction.
SQL can invoke predictive models or retrieve stored predictions as well. The distinction here concerns whether a value is computed from recorded events or estimates an outcome that is not yet known, rather than the language or interface used. In my view, retaining that distinction in the explanation is the starting point for adding predictive tools to enterprise AI.
One table, or tables connecting customers to orders
Passing prediction to a separate tool also changes the input. Kumo Tabular receives rows with known outcomes separately from the rows whose outcomes are to be predicted. It returns class probabilities for classification or numerical predictions for regression. A pretrained model uses known examples through in-context learning, without requiring a weight update each time it is used.
Customer information need not fit into one table. A customer table may contain one row per customer, an order table one per order, and a product table one per product, connected by identifiers. A single-table approach can first aggregate features such as purchase counts or days since the last order. Which period is aggregated changes the information the prediction receives.
Kumo Relational supports prediction across related tables. Its model card describes combining row representations with relational message passing. The underlying KumoRFM-2 paper describes using connected records and time without manually flattening the database into one table. The relationships through which useful predictive records can be reached therefore matter.
Reducing table preparation does not remove the need to define what the data means. Official documentation covers both column semantics and time columns. Incorrect customer identifiers, monetary units, or record-availability times change what reaches the model. Avoiding retraining does not mean there is no data left to check.
What the published customer-churn example establishes
The AdventureWorks example described in NVIDIA's official documentation makes this process tangible. The overview describes predicting whether an active customer will place no orders during the next 90 days, using customer and order history. The notebook guide describes building a relational graph from four tables and submitting prediction requests in PQL. It requires a deployed Kumo Relational NIM endpoint and the specified data files.
Churn here does not directly measure a customer's feelings. It is defined as an observable event over a specified period without orders. Applying the same 90 days to a customer who purchases annually changes its business meaning. Adapting the example to a company starts with deciding whose outcome to predict, over which period, and what the outcome is.
The official PQL tutorial gives a separate example specifying each customer's order amount over the next 30 days. The useful property is explicit specification of the customers, amount, and future interval. Even if an LLM translates a natural-language request into that query, checking its customers and interval remains separate work.
- Define the question: Specify customers, an outcome such as no orders, and a horizon such as 90 days.
- Prepare historical records: Preserve relationships and time; separate known outcomes from prediction inputs.
- Request predictions: Receive entity identifiers and probabilities or rankings.
- Have the team reconcile results: Consider policy, previous contacts, and available contact capacity.
Customer-level predictions also differ from daily demand forecasts. Kumo Forecast returns future values from timestamped numerical history; Kumo Anomaly detects anomalies in time series. Predicting who will stop buying and predicting next week's sales volume call for different inputs and evaluation. Sharing the Kumo name does not make these tools interchangeable.
Use only records available on the prediction date
For a prediction with a future horizon, merely using historical data is insufficient. Suppose an evaluation simulates a prediction on September 30 but includes cancellations finalized in October or customer categories updated later. It uses information unavailable on the supposed prediction date, an example of data leakage. Apparent accuracy in that evaluation would not be reproducible with the inputs available in production.
Kumo's time-column documentation describes specifying when a record became available and, where relevant, ceased to be valid, to select information for the prediction's anchor time. A datetime column need not represent availability, and a last-modified field is not automatically suitable. Reconstructing historical feature values also appears in Feast's point-in-time joins. Changing predictive tools does not remove the need to align what could have been known.
Time should also survive the result handoff.
The official result specification describes using the entity identifier, ENTITY, and the anchor time, ANCHOR_TIMESTAMP, when present, to join predictions to downstream data.
Attaching customer names by row position or displaying last month's probability as today's value can misdirect a decision even after successful inference.
The explanation needs similar care. Kumo's explainability documentation separates structured attribution for relevant records from an optional summary by a separately configured language model. I would give the team a way back from the summary to those records and the anchor time. Attribution must not be reinterpreted as proof of why a customer will leave, or that contacting them will improve the outcome.
From benchmark rankings to evaluation on company data
There is evidence supporting a trial of these methods. KumoRFM-2's authors report evaluation on 41 predictive tasks across 15 relational databases, comparing supervised methods and other foundation models. The evaluation draws on RelBench, which includes purchasing tasks, and RelBench v2, which adds domains including ERP. These offer a basis for comparison on relevant predictions rather than inferring suitability from language-generation scores.
NVIDIA's October 21 technical explanation reports an average improvement of nearly four AUROC points over gradient-boosted trees with expert-engineered features on RelBench V1 classification tasks. AUROC measures how well positives are ranked above negatives; that difference does not mean contacting customers increases revenue by 4%. Including an expert-engineered relational baseline, alongside methods given only an entity table, helps assess the value of using connected records.
They do not justify replacing every existing company model. TabArena shows that validation methods, tuning budgets, and model ensembles affect comparisons, with gradient-boosted trees remaining strong practical baselines. BeyondArena extends evaluation to settings including temporal and grouped tasks. Where customers and seasons change, random row splits alone are an inadequate basis for a deployment decision.
Using probabilities as business thresholds requires more than a good ranking. TabReliBench, published October 9, compares predictive performance, distributions, and subgroup calibration, reporting changes in rankings across metrics. Calibration concerns whether events occur about 80% of the time among cases assigned an 80% probability, for example. Its evaluated models do not include Kumo, so it neither validates nor disproves Kumo's probabilities directly. It nevertheless supports measuring probability reliability separately from predictive accuracy and ranking.
For the opening hypothetical workflow, I would compare candidates generated at identical historical cutoff dates against both a days-since-last-order rule and any existing predictive model. At the number of customers the team can actually contact, measure how many later stopped ordering and whether probabilities match observed frequencies. Record data-preparation, inference, and human-review time too. This is an evaluation proposal, not a measured benefit from a completed trial.
Start with a candidate list the team can verify
Even a useful prediction leaves the effect of contacting customers to be tested. Those most likely to stop ordering need not be those whose purchases would increase after contact. Selecting an effective intervention requires a comparison of the intervention's outcomes in addition to prediction evaluation. Calling a model and improving revenue should not be presented as one demonstrated achievement.
I therefore recommend starting with a candidate list whose evidence the team can inspect. Retain customer identifiers, anchor dates, prediction horizons, probabilities, and relevant records; let the LLM explain them alongside policy and past contact history. Staff can exclude duplicate contacts and already resolved cases before choosing a limited set. This stage allows comparison of predictive usefulness with the burden of checking and correcting results.
Adding structured predictive models lets an enterprise assistant combine policy reading, recorded-data computation, and estimates of unknown outcomes in one response. Preserving each operation's sources, times, and evaluation makes it possible to prepare material for choosing the next action, alongside producing explanations. I would judge that progress by the additional predictions staff can verify and use, rather than a model's leaderboard position.
This article compares official documentation and papers. It does not measure Kumo inference, accuracy on company data, latency, cost, or intervention effects. Public notebook documentation supports the workflow description, not a claim of demonstrated enterprise benefit.